Highlights
· 5 min read
A Khosra Demo Author
Blocks that lift a value out of the words and set it where the eye finds it.
Contents
Highlights
Each is one of khata’s calls, so the words around it stay Markdown (khata docs/authoring.md, “A value worth its own line”). A value, not only a number: a name or a word the piece turns on can stand in it the same way. The numbers are the season the tin on the roof kept.
Every block takes source= — words, or an address shown without its scheme — said under it.
Each demo shows what was written above what it draws.
A number on its own line
:::stat: the value, and what it is under it; unit a size down after it.
:::stat{label="June to September" unit=mm source="the roof gauge's log"}
2,431
:::
2,431
mmSource: the roof gauge's log
:::stat{label="the wettest month"}
July
:::
July
How it moved
The same with change and against: a mark for a rise or a fall, and never a colour, since more rain is neither good
nor bad.
:::stat{label="millimetres in July" change="+18%" against="on last July"}
341
:::
341
:::stat{label="dry days in August" change="−4" against="on last August"}
6
:::
6
With its trend
A :spark after the number, the months it was made of.
:::stat{label="millimetres, month by month"}
2,431 :spark[312, 401, 523, 678, 517]
:::
2,431 312, 401, 523, 678, 517
{ends} gives the line a scale to read it by: the first and last numbers either side of it, and a dot at each
end, so a rise reads as a rise from something to something.
The tin held :spark[312, 401, 523, 678, 517]{ends} millimetres a month, June to October.
The tin held 312, 401, 523, 678, 517 millimetres a month, June to October.
The numbers are small and set narrow, in Anek at its most condensed, so they mark the scale without standing as tall
as the words. {dots} is the quieter form: the dots alone, and the two numbers above the ends while a pointer rests on
the line.
The tin held :spark[312, 401, 523, 678, 517]{dots} millimetres a month, June to October.
The tin held 312, 401, 523, 678, 517 millimetres a month, June to October.
Inside a sentence
`:stat[…]`, the same value without breaking the line: July brought
:stat[341]{unit=mm change="+18%" against="on last July" source=https://example.org/monsoon-2026} into the tin, and August only
:stat[188]{unit=mm source="the roof gauge's log"}. A source is the value's own: an address links it, words are said when
it is pointed at.
:stat[…], the same value without breaking the line: July brought
341mm +18% on last July into the tin, and August only
188mm (Source: the roof gauge's log). A source is the value’s own: an address links it, words are said when
it is pointed at.
Beside the words
:::stat{runaround-right label="days it rained"}
117
:::
117
With {runaround-right} a figure stands beside the paragraph instead of breaking it, as a pull quote does: the
reader meets it at the height of the sentence that needs it. The tin overflowed twice in the first week of July, and
after that the roof was measured every evening rather than every morning, so the count of days it rained is the most
trusted number of the season. The rest of the paragraph runs on past it as an ordinary paragraph does, and the figure
keeps out of the margin, where the notes are.
A row of numbers
::::stats holds any number of :::stat, as many to a line as fit.
::::stats
:::stat{label="millimetres"}
2,431
:::

:::stat{label="days it rained"}
117
:::

:::stat{label="wettest day, mm"}
96
:::

:::stat{label="overflows"}
2
:::
::::
2,431
117
96
2
Five values in a width that holds four go as three and two, never four and one:
::::stats
:::stat{label="June" unit=mm}
312
:::

:::stat{label="July" unit=mm}
341
:::

:::stat{label="August" unit=mm}
188
:::

:::stat{label="September" unit=mm}
205
:::

:::stat{label="October" unit=mm}
96
:::
::::
312
mm341
mm188
mm205
mm96
mmSet against each other
::::stats{look=versus}, two values and what is compared.
::::stats{look=versus label="June to September: the tin on the roof against the airport's gauge, 6 km away"}
:::stat{label="the roof"}
2,431
:::

:::stat{label="the airport"}
2,190
:::
::::
2,431
2,190
How far along
:::meter, the browser’s own meter: value of max.
:::meter{value=341 max=500 label="millimetres in July, of the tin's 500"}
341
:::
341
A fact box
:::facts, a title over a list, each line opening on its value in bold.
:::facts{title="The season in numbers" source=https://example.org/monsoon-2026}
- **2,431 mm** fell between June and September
- **117** days of rain, out of 122
- **96 mm** on 14 July, the wettest day
- **2** overflows, both in the first week of July
:::
A thing’s particulars, two looks
For a book, a project or a walk rather than a piece’s numbers, the bold opener is the label and the words after it the
value — - **Licence** MIT — links and emphasis included. Two looks for it, to keep one: look=sheet sets each label
small in a column of its own, ruled like a specification table rather than boxed;
:::facts{title="The book" look=sheet}
- **Title** *Piranesi*
- **Author** Susanna Clarke
- **Published** 2020, Bloomsbury
- **Read** 3–9 March 2026, from [the library](/posts/in-the-margins/)
:::
:::facts{title="The walk" look=sheet source="the walking log"}
- **Distance** 42 km
- **Days** 3
- **Highest point** 1,052 m, at the pass
- **Weather** rain on the second day, all of it
:::
and look=ledger keeps the label at the line’s start and sets the value flush to its end.
:::facts{title="The book" look=ledger}
- **Title** *Piranesi*
- **Author** Susanna Clarke
- **Published** 2020, Bloomsbury
- **Read** 3–9 March 2026, from [the library](/posts/in-the-margins/)
:::
:::facts{title="The walk" look=ledger source="the walking log"}
- **Distance** 42 km
- **Days** 3
- **Highest point** 1,052 m, at the pass
- **Weather** rain on the second day, all of it
:::
From the site itself
:since, :until and :count say what the site holds and how long, measured when the page is served — so the
sentence stays true without being edited.
This site has been keeping notes for :since[first], in :count[publications] publications and :count[words] words —
:count[publications]{year=this} of them this year, :count[publications]{tag=monsoon} about the monsoon. The tin went
up on the roof :since[2024-06-01] ago; the next season opens in :until[2027-06-01]. :count[ideas] ideas wait.
This site has been keeping notes for , in 165 publications and 29,874 words — 136 of them this year, 16 about the monsoon. The tin went up on the roof ago; the next season opens in . 9 ideas wait.
| Written | Read |
|---|---|
:since[first] |
|
:since[2024-06-01] |
|
:until[2027-06-01] |
|
:count[publications] |
165 |
:count[publications]{in=posts} |
23 |
:count[publications]{year=this} |
136 |
:count[words] |
29,874 |
:count[words]{tag=monsoon} |
3,566 |
:count[ideas] |
9 |
When it was true
as-of= on any highlight or chart says the date its value held, beside its source; :::as-of{date=} says it over any
passage, and :as-of[…]{date=} after a phrase. A day, a month or a year, as the site writes dates.
:::stat{label="millimetres in the tin, the season so far" as-of=2026-08 source="the roof gauge's log"}
2,431
:::
2,431
Source: the roof gauge's log
:::as-of{date=2026-03}
The gauge reads to a fifth of a millimetre: the bucket tips at 0.2 mm, and the logger keeps a year of tips before it
writes over the oldest. Readings go up to the site every hour the network is there.
:::
The gauge reads to a fifth of a millimetre: the bucket tips at 0.2 mm, and the logger keeps a year of tips before it writes over the oldest. Readings go up to the site every hour the network is there.
The tin is :as-of[the only gauge on the street]{date=2026-11-17}, and the nearest station's record is
:stat[341]{unit=mm as-of=2025-07} for a July.
The tin is the only gauge on the street (), and the nearest station’s record is 341mm () for a July.
A number as a sentence says it
:num says a large number the way a sentence does: in the language’s own words for its scale, rounded to what a
reader takes in, and marked ~ where that rounded it — the exact number is under the pointer. {exact} writes every
digit. Under ten thousand a number is always exact.
The catchment drains :num[12000201] people's roofs and, on a wet day, :num[1840000000] litres of water — about
:num[450000] of them through the old city's one storm drain, which was built for :num[9500].
The catchment drains ~12 million people’s roofs and, on a wet day, ~1.8 billion litres of water — about 450 thousand of them through the old city’s one storm drain, which was built for 9,500.
| Written | Read |
|---|---|
:num[12000201] |
~12 million |
:num[12000000] |
12 million |
:num[1840000000] |
~1.8 billion |
:num[450000] |
450 thousand |
:num[9500] |
9,500 |
:num[12000201]{exact} |
12,000,201 |
Notes on a chart
After a chart’s table, a list whose every item opens with one of its rows and a : is notes on those rows: each one’s
number marks its row’s point and stays on it at any width; the notes are under the drawing.
:::chart{caption="Rain by month, 2026, in millimetres" as-of=2026-09 source="the roof gauge's log"}
| month | mm |
|---|---|
| Jun | 412 |
| Jul | 341 |
| Aug | 188 |
| Sep | 96 |

- Jun: The wettest month, a week of storms in its middle.
- Aug: The gauge moved to the roof's ridge, out of the neighbour's tree.
:::
- Jun The wettest month, a week of storms in its middle.
- Aug The gauge moved to the roof’s ridge, out of the neighbour’s tree.
Source: the roof gauge's log
The numbers
| month | mm |
|---|---|
| Jun | 412 |
| Jul | 341 |
| Aug | 188 |
| Sep | 96 |
A chart drawn from a data file has nothing in its body but the notes, naming its rows as the file does.
:::chart{line data=rain x=day y=mm caption="Rain, 1–14 June"}
- 2026-06-03: The first storm of the season.
- 2026-06-10: The bucket jammed; two hours lost.
:::
- 3 June 2026 The first storm of the season.
- 10 June 2026 The bucket jammed; two hours lost.
The numbers
| day | mm |
|---|---|
| 1 June 2026 | 0 |
| 2 June 2026 | 4.5 |
| 3 June 2026 | 12 |
| 4 June 2026 | 9 |
| 5 June 2026 | 31 |
| 6 June 2026 | 22.5 |
| 7 June 2026 | 3 |
| 8 June 2026 | 0 |
| 9 June 2026 | 7 |
| 10 June 2026 | 18 |
| 11 June 2026 | 44 |
| 12 June 2026 | 26 |
| 13 June 2026 | 10 |
| 14 June 2026 | 2 |
Notes on a diagram
:::annotated holds a diagram as it holds a picture, its notes placed by percent across and down.
:::annotated
```dot alt="A reading goes from the gauge to the logger, and from the logger to the site, or to a card."
digraph { rankdir=LR; node [shape=box]; gauge -> logger -> site; logger -> card [style=dashed] }
```

Where a reading goes.

- 15 30: **The gauge**, a tipping bucket in a tin.
- 47 30: The logger counts tips and keeps a year of them.
- 92 5: The site, every hour the network is there.
:::
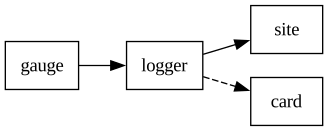
Where a reading goes.
- 1The gauge, a tipping bucket in a tin.
- 2The logger counts tips and keeps a year of them.
- 3The site, every hour the network is there.
A rating on a review
A rating is written in the citation’s own block in a post’s frontmatter, not as a call: rating: out of five, or
7/10 out of ten. It is drawn as stars under the card, and on the card where the post is listed — see
the review of Outer Wilds.
review-of:
  url: https://store.steampowered.com/app/753640
  name: Outer Wilds
  summary: The only game whose map is a clock.
  rating: 4.5
Subscribe
Readings go up when the gauge has been read, not on a schedule: most weeks twice, every day in the monsoon. However you follow, nothing about you is kept here.
- In a feed reader
- Atom · JSON Feed. Each section has a feed of its own, at its address followed by feed.xml.
- In the fediverse
- Search for https://adventure.x.bdeshi.space/ in Mastodon or any other fediverse app, and follow it.
- From your own site
- Follow https://adventure.x.bdeshi.space/ in an IndieWeb reader. A reply, like or repost from your own site reaches the post here by webmention.
Highlights
Each is one of khata’s calls, so the words around it stay Markdown (khata docs/authoring.md, “A value worth its own line”). A value, not only a number: a name or a word the piece turns on can stand in it the same way. The numbers are the season the tin on the roof kept.
Every block takes source= — words, or an address shown without its scheme — said under it.
Each demo shows what was written above what it draws.
A number on its own line
:::stat: the value, and what it is under it; unit a size down after it.
:::stat{label="June to September" unit=mm source="the roof gauge's log"}
2,431
:::
2,431
mmSource: the roof gauge's log
:::stat{label="the wettest month"}
July
:::
July
How it moved
The same with change and against: a mark for a rise or a fall, and never a colour, since more rain is neither good
nor bad.
:::stat{label="millimetres in July" change="+18%" against="on last July"}
341
:::
341
:::stat{label="dry days in August" change="−4" against="on last August"}
6
:::
6
With its trend
A :spark after the number, the months it was made of.
:::stat{label="millimetres, month by month"}
2,431 :spark[312, 401, 523, 678, 517]
:::
2,431 312, 401, 523, 678, 517
{ends} gives the line a scale to read it by: the first and last numbers either side of it, and a dot at each
end, so a rise reads as a rise from something to something.
The tin held :spark[312, 401, 523, 678, 517]{ends} millimetres a month, June to October.
The tin held 312, 401, 523, 678, 517 millimetres a month, June to October.
The numbers are small and set narrow, in Anek at its most condensed, so they mark the scale without standing as tall
as the words. {dots} is the quieter form: the dots alone, and the two numbers above the ends while a pointer rests on
the line.
The tin held :spark[312, 401, 523, 678, 517]{dots} millimetres a month, June to October.
The tin held 312, 401, 523, 678, 517 millimetres a month, June to October.
Inside a sentence
`:stat[…]`, the same value without breaking the line: July brought
:stat[341]{unit=mm change="+18%" against="on last July" source=https://example.org/monsoon-2026} into the tin, and August only
:stat[188]{unit=mm source="the roof gauge's log"}. A source is the value's own: an address links it, words are said when
it is pointed at.
:stat[…], the same value without breaking the line: July brought
341mm +18% on last July into the tin, and August only
188mm (Source: the roof gauge's log). A source is the value’s own: an address links it, words are said when
it is pointed at.
Beside the words
:::stat{runaround-right label="days it rained"}
117
:::
117
With {runaround-right} a figure stands beside the paragraph instead of breaking it, as a pull quote does: the
reader meets it at the height of the sentence that needs it. The tin overflowed twice in the first week of July, and
after that the roof was measured every evening rather than every morning, so the count of days it rained is the most
trusted number of the season. The rest of the paragraph runs on past it as an ordinary paragraph does, and the figure
keeps out of the margin, where the notes are.
A row of numbers
::::stats holds any number of :::stat, as many to a line as fit.
::::stats
:::stat{label="millimetres"}
2,431
:::

:::stat{label="days it rained"}
117
:::

:::stat{label="wettest day, mm"}
96
:::

:::stat{label="overflows"}
2
:::
::::
2,431
117
96
2
Five values in a width that holds four go as three and two, never four and one:
::::stats
:::stat{label="June" unit=mm}
312
:::

:::stat{label="July" unit=mm}
341
:::

:::stat{label="August" unit=mm}
188
:::

:::stat{label="September" unit=mm}
205
:::

:::stat{label="October" unit=mm}
96
:::
::::
312
mm341
mm188
mm205
mm96
mmSet against each other
::::stats{look=versus}, two values and what is compared.
::::stats{look=versus label="June to September: the tin on the roof against the airport's gauge, 6 km away"}
:::stat{label="the roof"}
2,431
:::

:::stat{label="the airport"}
2,190
:::
::::
2,431
2,190
How far along
:::meter, the browser’s own meter: value of max.
:::meter{value=341 max=500 label="millimetres in July, of the tin's 500"}
341
:::
341
A fact box
:::facts, a title over a list, each line opening on its value in bold.
:::facts{title="The season in numbers" source=https://example.org/monsoon-2026}
- **2,431 mm** fell between June and September
- **117** days of rain, out of 122
- **96 mm** on 14 July, the wettest day
- **2** overflows, both in the first week of July
:::
A thing’s particulars, two looks
For a book, a project or a walk rather than a piece’s numbers, the bold opener is the label and the words after it the
value — - **Licence** MIT — links and emphasis included. Two looks for it, to keep one: look=sheet sets each label
small in a column of its own, ruled like a specification table rather than boxed;
:::facts{title="The book" look=sheet}
- **Title** *Piranesi*
- **Author** Susanna Clarke
- **Published** 2020, Bloomsbury
- **Read** 3–9 March 2026, from [the library](/posts/in-the-margins/)
:::
:::facts{title="The walk" look=sheet source="the walking log"}
- **Distance** 42 km
- **Days** 3
- **Highest point** 1,052 m, at the pass
- **Weather** rain on the second day, all of it
:::
and look=ledger keeps the label at the line’s start and sets the value flush to its end.
:::facts{title="The book" look=ledger}
- **Title** *Piranesi*
- **Author** Susanna Clarke
- **Published** 2020, Bloomsbury
- **Read** 3–9 March 2026, from [the library](/posts/in-the-margins/)
:::
:::facts{title="The walk" look=ledger source="the walking log"}
- **Distance** 42 km
- **Days** 3
- **Highest point** 1,052 m, at the pass
- **Weather** rain on the second day, all of it
:::
From the site itself
:since, :until and :count say what the site holds and how long, measured when the page is served — so the
sentence stays true without being edited.
This site has been keeping notes for :since[first], in :count[publications] publications and :count[words] words —
:count[publications]{year=this} of them this year, :count[publications]{tag=monsoon} about the monsoon. The tin went
up on the roof :since[2024-06-01] ago; the next season opens in :until[2027-06-01]. :count[ideas] ideas wait.
This site has been keeping notes for , in 165 publications and 29,874 words — 136 of them this year, 16 about the monsoon. The tin went up on the roof ago; the next season opens in . 9 ideas wait.
| Written | Read |
|---|---|
:since[first] |
|
:since[2024-06-01] |
|
:until[2027-06-01] |
|
:count[publications] |
165 |
:count[publications]{in=posts} |
23 |
:count[publications]{year=this} |
136 |
:count[words] |
29,874 |
:count[words]{tag=monsoon} |
3,566 |
:count[ideas] |
9 |
When it was true
as-of= on any highlight or chart says the date its value held, beside its source; :::as-of{date=} says it over any
passage, and :as-of[…]{date=} after a phrase. A day, a month or a year, as the site writes dates.
:::stat{label="millimetres in the tin, the season so far" as-of=2026-08 source="the roof gauge's log"}
2,431
:::
2,431
Source: the roof gauge's log
:::as-of{date=2026-03}
The gauge reads to a fifth of a millimetre: the bucket tips at 0.2 mm, and the logger keeps a year of tips before it
writes over the oldest. Readings go up to the site every hour the network is there.
:::
The gauge reads to a fifth of a millimetre: the bucket tips at 0.2 mm, and the logger keeps a year of tips before it writes over the oldest. Readings go up to the site every hour the network is there.
The tin is :as-of[the only gauge on the street]{date=2026-11-17}, and the nearest station's record is
:stat[341]{unit=mm as-of=2025-07} for a July.
The tin is the only gauge on the street (), and the nearest station’s record is 341mm () for a July.
A number as a sentence says it
:num says a large number the way a sentence does: in the language’s own words for its scale, rounded to what a
reader takes in, and marked ~ where that rounded it — the exact number is under the pointer. {exact} writes every
digit. Under ten thousand a number is always exact.
The catchment drains :num[12000201] people's roofs and, on a wet day, :num[1840000000] litres of water — about
:num[450000] of them through the old city's one storm drain, which was built for :num[9500].
The catchment drains ~12 million people’s roofs and, on a wet day, ~1.8 billion litres of water — about 450 thousand of them through the old city’s one storm drain, which was built for 9,500.
| Written | Read |
|---|---|
:num[12000201] |
~12 million |
:num[12000000] |
12 million |
:num[1840000000] |
~1.8 billion |
:num[450000] |
450 thousand |
:num[9500] |
9,500 |
:num[12000201]{exact} |
12,000,201 |
Notes on a chart
After a chart’s table, a list whose every item opens with one of its rows and a : is notes on those rows: each one’s
number marks its row’s point and stays on it at any width; the notes are under the drawing.
:::chart{caption="Rain by month, 2026, in millimetres" as-of=2026-09 source="the roof gauge's log"}
| month | mm |
|---|---|
| Jun | 412 |
| Jul | 341 |
| Aug | 188 |
| Sep | 96 |

- Jun: The wettest month, a week of storms in its middle.
- Aug: The gauge moved to the roof's ridge, out of the neighbour's tree.
:::
- Jun: The wettest month, a week of storms in its middle.
- Aug: The gauge moved to the roof’s ridge, out of the neighbour’s tree.
Source: the roof gauge's log
| month | mm |
|---|---|
| Jun | 412 |
| Jul | 341 |
| Aug | 188 |
| Sep | 96 |
A chart drawn from a data file has nothing in its body but the notes, naming its rows as the file does.
:::chart{line data=rain x=day y=mm caption="Rain, 1–14 June"}
- 2026-06-03: The first storm of the season.
- 2026-06-10: The bucket jammed; two hours lost.
:::
- 2026-06-03: The first storm of the season.
- 2026-06-10: The bucket jammed; two hours lost.
| day | mm |
|---|---|
| 1 June 2026 | 0 |
| 2 June 2026 | 4.5 |
| 3 June 2026 | 12 |
| 4 June 2026 | 9 |
| 5 June 2026 | 31 |
| 6 June 2026 | 22.5 |
| 7 June 2026 | 3 |
| 8 June 2026 | 0 |
| 9 June 2026 | 7 |
| 10 June 2026 | 18 |
| 11 June 2026 | 44 |
| 12 June 2026 | 26 |
| 13 June 2026 | 10 |
| 14 June 2026 | 2 |
Notes on a diagram
:::annotated holds a diagram as it holds a picture, its notes placed by percent across and down.
:::annotated
```dot alt="A reading goes from the gauge to the logger, and from the logger to the site, or to a card."
digraph { rankdir=LR; node [shape=box]; gauge -> logger -> site; logger -> card [style=dashed] }
```

Where a reading goes.

- 15 30: **The gauge**, a tipping bucket in a tin.
- 47 30: The logger counts tips and keeps a year of them.
- 92 5: The site, every hour the network is there.
:::
Where a reading goes.
- The gauge, a tipping bucket in a tin.
- The logger counts tips and keeps a year of them.
- The site, every hour the network is there.
A rating on a review
A rating is written in the citation’s own block in a post’s frontmatter, not as a call: rating: out of five, or
7/10 out of ten. It is drawn as stars under the card, and on the card where the post is listed — see
the review of Outer Wilds.
review-of:
  url: https://store.steampowered.com/app/753640
  name: Outer Wilds
  summary: The only game whose map is a clock.
  rating: 4.5
Readings go up when the gauge has been read, not on a schedule: most weeks twice, every day in the monsoon. However you follow, nothing about you is kept here.
- In a feed reader
- Atom · JSON Feed. Each section has a feed of its own, at its address followed by feed.xml.
- In the fediverse
- Search for https://adventure.x.bdeshi.space/ in Mastodon or any other fediverse app, and follow it.
- From your own site
- Follow https://adventure.x.bdeshi.space/ in an IndieWeb reader. A reply, like or repost from your own site reaches the post here by webmention.